A guide, not a brochure
Moodle Analytics: What Moodle Shows You, What It Cannot, and How to Get the Rest.
Moodle records almost everything a learner does. Turning that record into answers is the job of analytics, and Moodle does part of it out of the box. This guide covers what you already have, the questions it leaves open, how an analytics layer fills them, and the questions worth asking any vendor before you pay. Checked against Moodle's documentation on 7 October 2026.
Start freeInstant demoOr read the guide below.

Who needs someone this weekThe question analytics exists to answer.
On this page
Seven short chapters. Each heading is a question, and the first sentence under it is the answer.
What does Moodle analytics mean?
Descriptive, diagnostic, predictive, prescriptive.
What analytics does Moodle give you out of the box?
Logs, course reports, custom reports, the at-risk model, community plugins.
Which questions can Moodle not answer on its own?
Nine, one per card.
How does a Moodle analytics layer work?
Read, prepare, show. Three parts.
What should you ask any Moodle analytics vendor?
Eight questions with a right answer.
What LearnBoard adds to Moodle
Six screens, one connection.
Questions people ask
Eight short answers.
Chapter 1
What does Moodle analytics mean?
Moodle analytics is the work of turning Moodle's activity, grade and completion records into answers about learners, courses and the organisation. Moodle's own documentation splits it into four kinds: descriptive, what happened; diagnostic, why it happened; predictive, what will happen next; and prescriptive, what to do about it.
Most reporting stops at the first kind. A completion report tells you that 61 percent of a cohort finished. Diagnostic analytics tells you the 39 percent who did not stalled at the same quiz. Predictive analytics tells you which learners in this cohort are heading the same way. Prescriptive analytics tells you who to call this week and what to say.
The distinction matters because the value sits at the far end. Nobody needs a dashboard to learn that something went wrong last term. The question a head of learning actually asks on a Monday is who needs someone this week, and that is a predictive and prescriptive question.
Chapter 2
What analytics does Moodle give you out of the box?
Moodle ships with logs, course reports, a custom report builder and a learning analytics engine, and together they answer most descriptive questions well.
Logs and course reports
Every Moodle course carries a set of reports: logs and live logs of every event, activity completion, course participation, activity report, grade reports and the course completion report. They answer "did this learner open this resource" and "who has completed this activity" precisely, one course at a time. They do not add up across courses, and they export to spreadsheet rather than chart.
Custom reports
Since Moodle 4.0, site administrators can build custom reports from fifteen data sources (users, courses, course participants, cohorts, competencies, badges and others), add conditions and filters, give them an audience, and schedule them by email hourly, daily, weekly or monthly. They are tables. Charts, dashboards and cross-course trends are outside their scope. The Report builder with charts belongs to Moodle Workplace, not Moodle LMS.
The learning analytics engine
Moodle core includes a learning analytics engine with three models: Students at risk of dropping out, Upcoming activities due, and No teaching. When a model is enabled and trained, it sends insights to teachers, for example a list of students predicted to drop out of a course, with suggested actions such as sending a message.
Three things to know before relying on it. The at-risk model must be trained on your own site's historical data before it predicts anything, and a new site has none. The models are off by default and need an administrator to enable them, with cron running. And the prediction is a flag per course: it does not show a learner's score across all their courses, the signals behind it, or what changed since last week.
Community plugins
Configurable Reports and Custom SQL queries are long-standing community plugins that let an administrator write SQL against the Moodle database and show the result as a table or a simple chart. They are powerful in the right hands, and they need those hands: every report is a query someone writes, maintains across Moodle upgrades and explains to the next administrator.
Chapter 3
Which questions can Moodle not answer on its own?
Moodle answers "what happened in this course". The questions below cross courses, cross time or need a judgement, and that is where the built-in tools stop.
Learners
Who is about to drop out, across every course, and why?
Moodle's model flags per course after training. It does not score a learner once, show the signals, or suggest a step.
Courses
Where in the course do learners stop?
A completion funnel from enrolment to certificate, per course, is not a Moodle report.
Cohorts
How does this intake compare with the last one?
Cohort against cohort, team against team, site against site, in one chart.
Compliance
Who is out of compliance, and when does it expire?
Mandatory training and certification expiry by department, role and location, with the overdue list.
Assessment
Which assessments are too easy, too hard or marked late?
Question-level difficulty and marking turnaround across courses.
Budget
Which courses are worth what they cost?
Cost per completion and return by course, which needs cost data Moodle does not hold.
Multi-site
What is happening across several Moodle sites?
Moodle reports on one site.
Regulators
What do the regulator's figures look like before we file them?
AVETMISS, TVA and audit evidence in the regulator's shape.
Managers
Can a manager ask the question in plain English?
Moodle's reports are built by administrators; the manager waits for the export.
Chapter 4
How does a Moodle analytics layer work?
A Moodle analytics layer reads your Moodle data, prepares the answers on its own server, and shows them as dashboards, usually back inside Moodle as well. Three parts, in the order the data moves.


A read-only connection
The layer connects to the Moodle database with an account that can only read, or through a plugin that hands over data on request. Nothing is written back; grades, enrolments and settings stay exactly as they are.
Preparation off your server
The heavy counting runs on the analytics server on a schedule, so dashboards open from prepared figures rather than running a query against the server your learners are using.
Dashboards, inside and outside Moodle
The answers appear in the analytics product and, through a Moodle plugin, on Moodle pages themselves, so a teacher or a manager sees them where they already work.
Two designs
Where does the data live?
Two designs exist for the first part, and the difference matters for privacy. Some products copy your Moodle data into their own cloud and report from the copy. Others read your Moodle in place and keep no second copy of learner records. Ask which one you are buying, and where the copy lives if there is one.
Chapter 5
What should you ask any Moodle analytics vendor?
Eight questions, each with a right answer you can check.
- Where does our data live? In place, or copied to your cloud, and in which country?
- How fresh are the numbers? Live, hourly, daily, or when someone presses refresh?
- Does any of it run on our Moodle server? Reports that run inside Moodle slow the server your learners are using as the site grows.
- Is the risk score explained? A number without the signals behind it cannot be acted on or defended.
- Can a manager ask a question without SQL? If every new question is a query, the backlog returns.
- Can we see the full list of dashboards before we buy? A catalogue by name, not a capability description.
- Is the price published? If it takes a call to see a number, budget for the calls.
- Can we see it on our own data before anyone calls us? A demo without a sales process is the quickest test of all of the above.
The compare page puts the main Moodle analytics products side by side on these questions, sourced and dated.
Chapter 6
What LearnBoard adds to Moodle
LearnBoard is a Moodle analytics layer built on the answers above. It reads your Moodle in place, read-only at three layers, with no copy of learner records anywhere else, and refreshes every hour or sooner on your schedule. Fifty dashboards are ready the day you connect, in nine packs, five of them written for one sector each: schools, higher education, corporate learning, government, and vocational training providers.
- Every learner at risk gets a 0 to 100 score, the signals behind it and a suggested next step you can act on in one click.
- Every chart carries an Ask AI button that answers in plain English, on every plan.
- Scheduled reports arrive by email or PDF; alerts fire when a threshold is crossed.
- A free Moodle plugin puts the real charts on your Moodle pages, nothing boxed in a frame, with one click into the full product.
- Every dashboard is named before you buy, every price is published, and a free plan with eight dashboards never expires.
- The instant demo opens in under a minute. No call.
Six of the fifty
Six screens that answer chapter 3
Each of these exists before you connect anything, and fills with your own Moodle numbers the day you do.
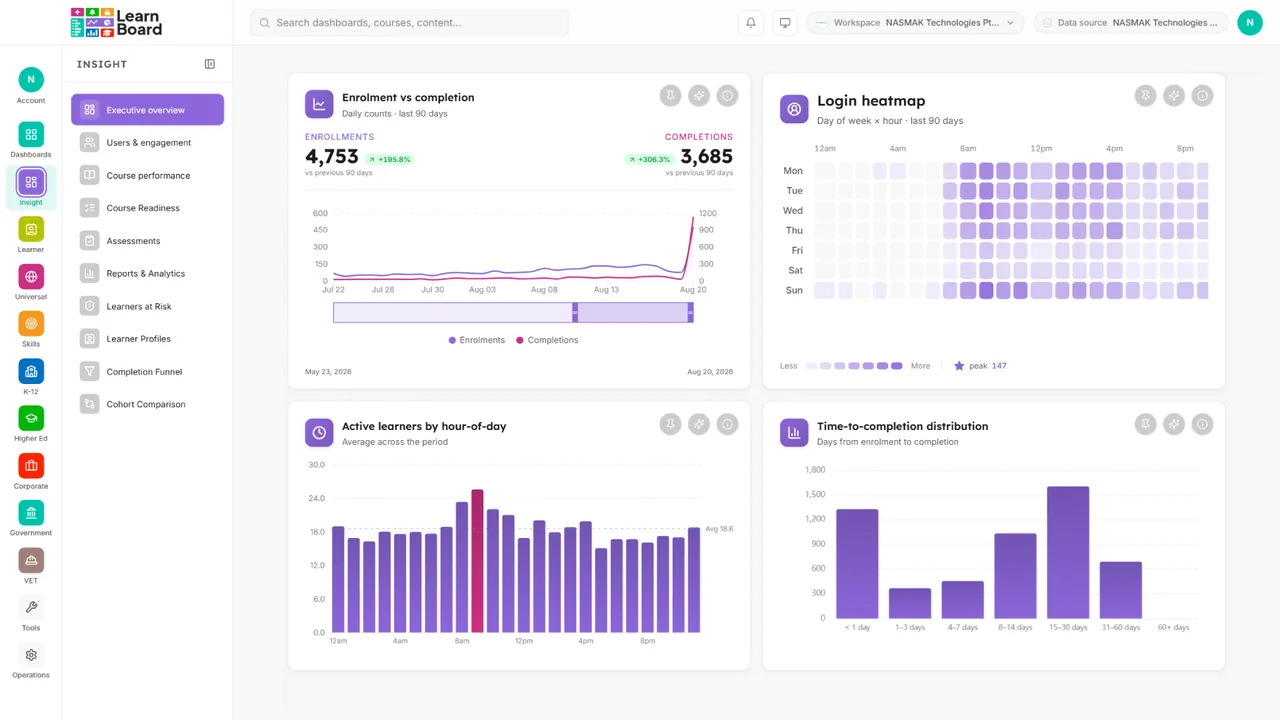
Executive overview
Fifty dashboards start here, filled the day you connect.
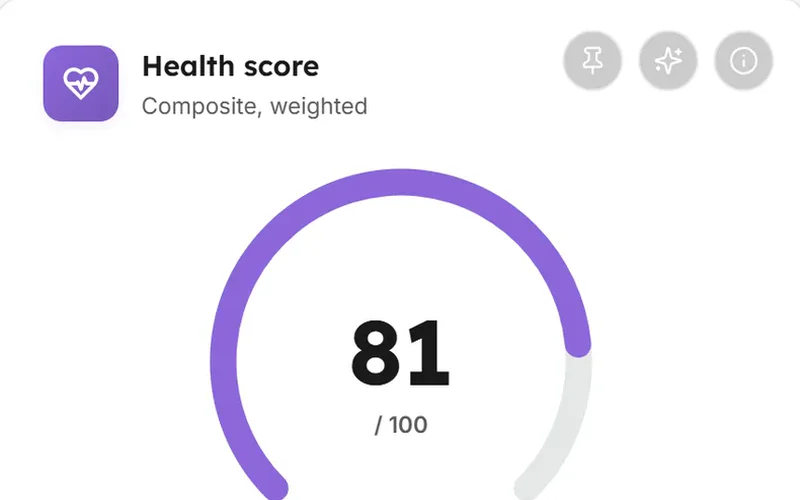
Learners at risk
A 0 to 100 score per learner, the signals behind it and the next step.
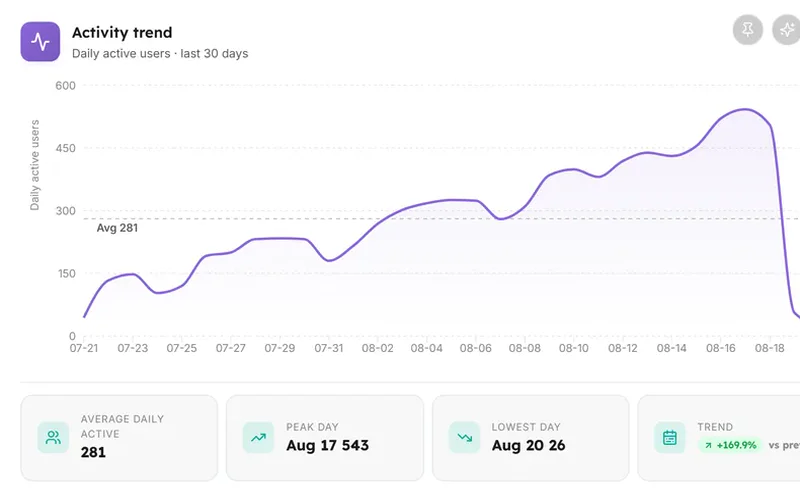
Ask AI
Every chart answers in plain English, on every plan.
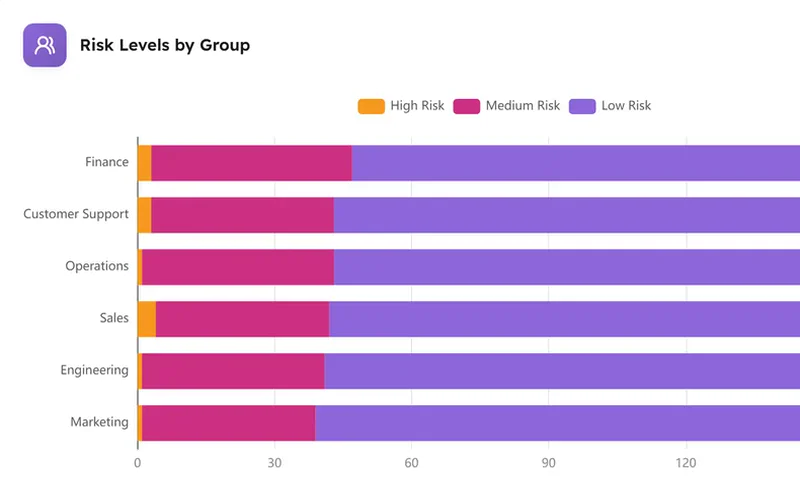
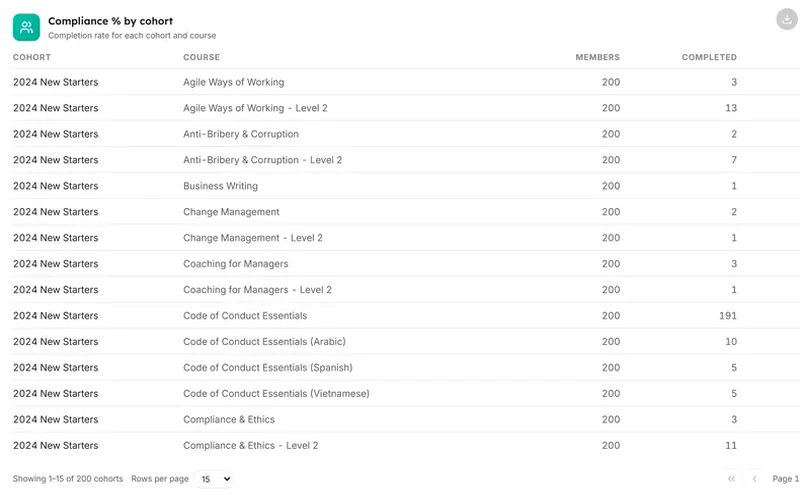
Compliance
Mandatory training and certification expiry by team, role and site.
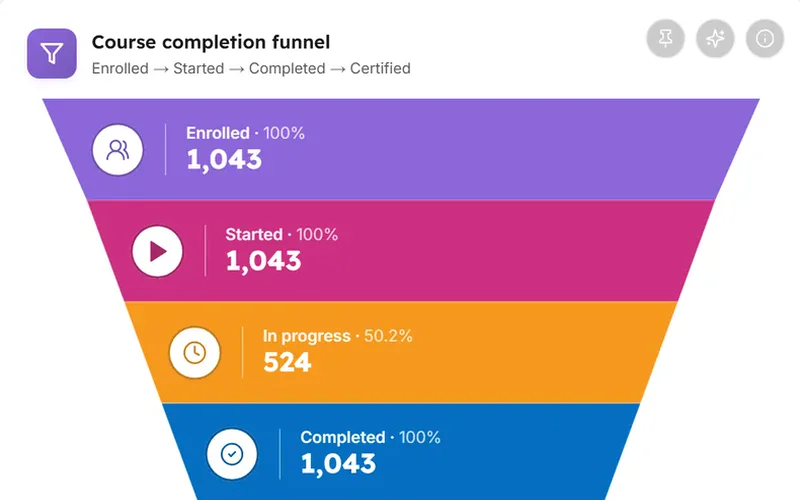
Completion funnel
Where learners stop, from enrolment to certificate.
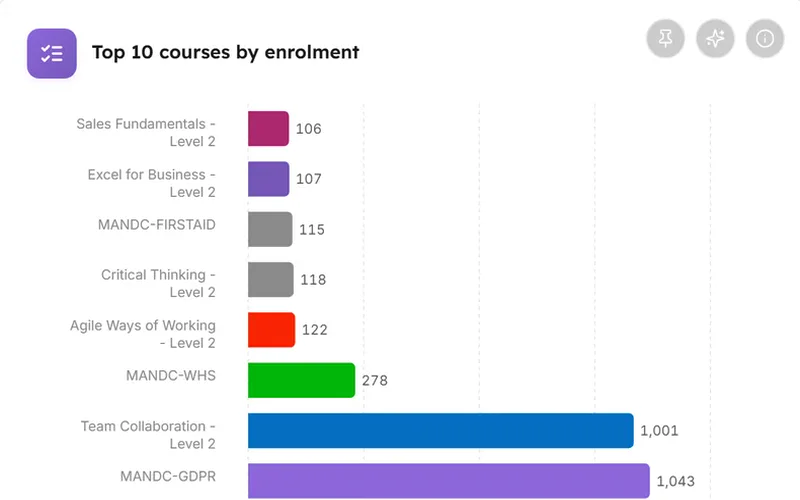
Your own board
Pin any chart, arrange it, set it as home.
Questions
Questions people ask about Moodle analytics.
Does Moodle have built-in analytics?
Yes. Moodle includes course reports, custom reports from fifteen data sources, and a learning analytics engine with three models, including Students at risk of dropping out. The at-risk model has to be enabled and trained on your own site's history before it predicts anything.
What is the difference between Moodle reports and Moodle analytics?
Reports describe what happened, one course at a time. Analytics explains why, predicts what comes next and suggests what to do, across courses and cohorts. Moodle's documentation uses the same split: descriptive, diagnostic, predictive, prescriptive.
Can Moodle show a dashboard?
Not from its own reports. Custom reports produce tables; charts and dashboards come from Moodle Workplace, from community plugins that need SQL, or from an analytics layer that reads Moodle.
Does a Moodle analytics tool need access to write to Moodle?
No. A well-built one reads only. LearnBoard's connection is read-only at three layers: the database grants allow only reads, a validator rejects anything that is not a read, and the connection itself refuses writes.
Will analytics slow our Moodle down?
Reports that run inside Moodle can, as the site grows. A layer that prepares its figures on its own server does not; only the charts you choose to embed appear on Moodle pages.
How is a learner's risk score calculated in LearnBoard?
From four signals: days since last login, course progress, recent grade trend and activity drop-off, blended into a 0 to 100 score. The points behind each learner's score are shown, and a next step is suggested.
Which Moodle versions does LearnBoard support?
Moodle 4.0 to 5.3, and LearnNoow. Canvas is coming soon.
What does it cost?
Free for eight dashboards and 500 learners, never expiring. Pro US$99 a month, Business US$399, Scale US$899, Enterprise quoted. Every price is on the pricing page.

See your Moodle's answers, not its logs
Connect read-only and fifty dashboards fill in the same session. Free for 14 days, no card, no call.
Built for LearnNoow and Moodle.
50
dashboards across engagement, courses, assessments, risk, skills and compliance
94
widget kinds every chart, table and KPI tile, individually pinnable and embeddable
8
packs Core, Insights, Skills, K-12, Higher Ed, Corporate, Government and VET or RTO
$0
to start eight dashboards and the Moodle embed plugin, free
0
hidden prices every tier through $899 a month is published; only Enterprise is quoted